Cross-selling has never been easier! An analysis with artificial intelligence-based engine
Cross-selling is a sales technique that enables companies and marketing channels to increase their sales by selling a complementary product to customers as well as the product they purchase. For instance, when buying a mobile phone from a store, the seller would like to sell you more products by recommending a phone case that suits the model of phone you bought, or when you order a burger in a restaurant, the seller applies the cross-selling technique to you with asking “Would you like chips next to the hamburger?”. With cross-selling, you can increase your sales, gain more and ensure customer loyalty.
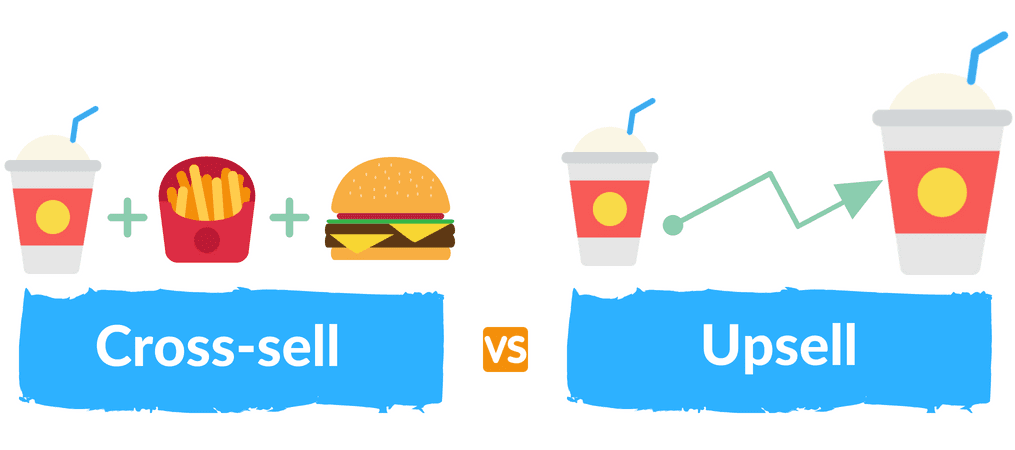
Upselling is to convince the customer to buy a product that they will spend more money on, or a higher model of a product they plan to buy. As cross-sell, when you order a menu from a fast-food chain, the question which is “Would you like a big size with a difference of fifty-cent?” is an example of upselling. You can take advantage of cross-selling when upselling is not usable for the customer. It is also possible to do the opposite. You can use one of these two sales techniques according to the feature of the specialty of your products or customer, or you can combine them both and increase your return.
As a result, upselling and cross-selling are mutually advantageous when applied correctly, providing customers maximum value and increasing revenue without the recurring cost of many marketing channels and companies.
Up Sell and Cross Sell on Real Data
In this project, it is predicted which customer will be cross-sell based on bank data from www.kaggle.com
Data include 20.000 ID which refers to one customer in total and each customer evaluated as 1 and 0. According to OptiScorer’s rules, the first column of the data to be uploaded should contain ID which is different from each other and the last column should specify a target and contain a numerical value. The first column of data was the desired format, but the target column was in the second column instead of the last column. Python’s pandas library was used to convert the data to the desired format. The data was divided into two different CSV files which are test and train files to train the model. In pandas, the main data was separated from the bottom line of data 30% as test data and 70% as training data. In other words, while 30% of the main data was used as a test, the rest of the data was used to train. The test data which is allocated as 30%, contains the ID numbers and other columns of the data that we want to train for the model to be generated to predict which customer will be cross-selling. From the separated test data, the target column that used for prediction was dropped. Predictions obtained as a result of data training are indicated in the tables below.
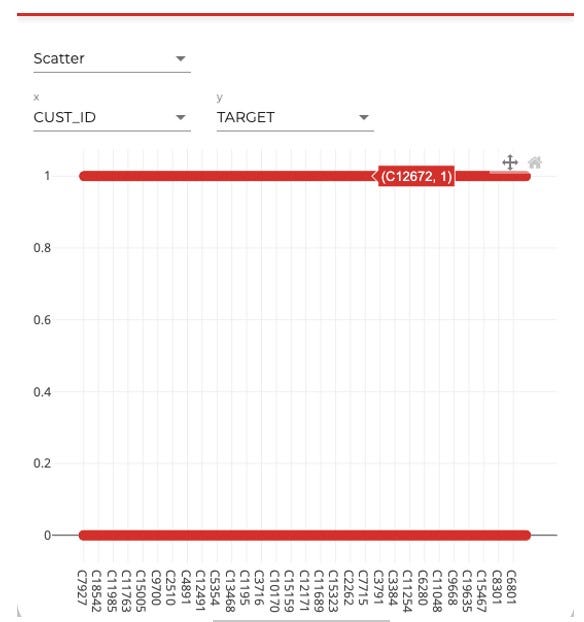
The CUST_ID in Table 1 refers to the column mentioned above, and TARGET refers to the target column. In data, which used to train the model, the target column was specified as 1 (cross-selling customers) and 0 (non-cross-selling customers). The X-axis represents customers with unique ID numbers, Y-axis represents the customers that are separated as 1 and 0.
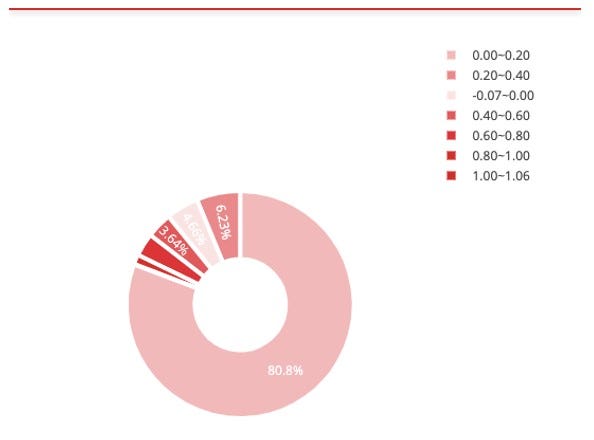
Table 2 shows the range of customer distributions.
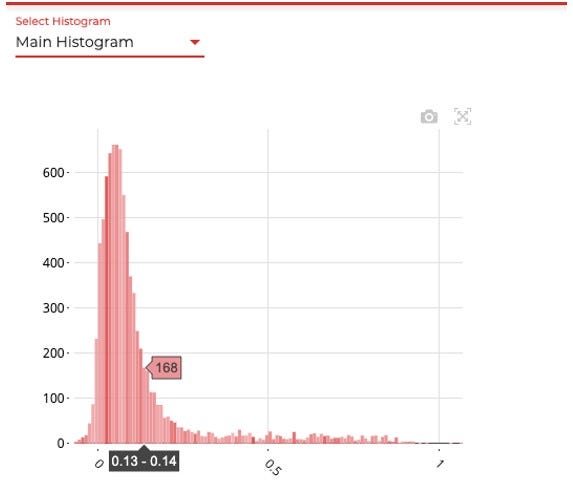
Table 3 shows the total number of customers between 0 and 1. For example, there are 168 customers in the range of 0.13–0.14.
It is possible to choose three different states (high, normal and low) from the select histogram section. High shows the distribution of customers in the range of 0.5–1. This is the highest probability of cross-selling customers. Normal shows the distribution of customers in the range of 0.3–0.5. This is the average probability of cross-selling customers. Low shows the distribution of customers in the range of 0–0.3. This is the range where the probability of cross-selling customers is minimum.

Table 4 shows customer’s ID and their predicted scores.

In Table 5, the customers indicated by blue arrow are classified as cross-sell, and those indicated by red arrow are non-cross-sell customers.
When the results of all these analyses are shared with CRM teams; loyalty programs and campaigns are prioritized according to customers. Also, when shared with sales teams, the products are offered to the targeted customers. The effect of artificial intelligence cannot be denied in increasing productivity for business processes, as seen in these analyses. With OptiScorer, each business can analyze its processes with a monthly membership in minutes and predict its future.